 View full image: US de-SPAC M&A and US SPAC IPOs (PDF)
US de-SPAC M&A: Commentary
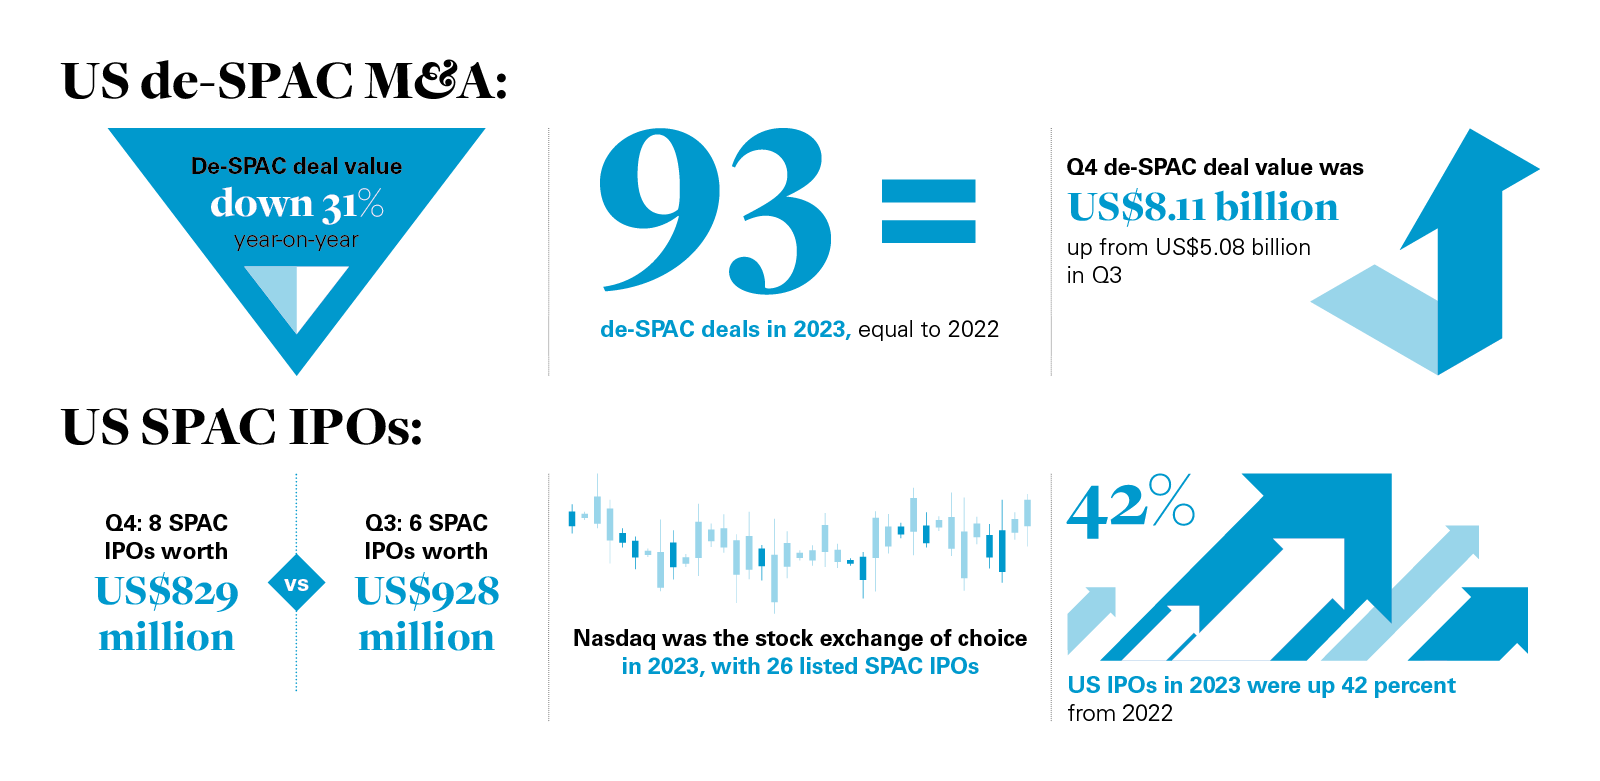
US de-SPAC business combination deal value totaled US$29.09 billion in 2023, down 31 percent year-on-year from the US$42.40 billion posted in 2022.
The contraction in de-SPAC deal value has tracked a similar decline in wider global M&A markets, where deal value has fallen 18 percent to a decade low of approximately US$3 trillion, according to Dealogic figures reported by Reuters1.
Despite the slide, de-SPAC deal value remains ahead of pre-pandemic levels (de-SPAC deal value came in at US$24.47 billion in 2019), although still well shy of the US$365.63 billion of value posted at the peak of the SPAC boom in 2021
Falling de-SPAC deal value, however, has not impacted transaction volumes, with 93 de-SPAC business combinations announced in 2023, the same count as 2022. Only 2021 (196 transactions) and 2020 (99 transactions) have posted a higher annual deal count during the past five years.
Check sizes may be smaller, but resilient deal volume numbers indicate that smaller companies continue to see de-SPAC business combinations as a viable and attractive pathway to a listing on public markets.
On a quarter-by-quarter basis, de-SPAC deal value improved, with US$8.11 billion of deals announced in Q4 2023, up from US$5.08 billion in Q3 2023. Final quarter numbers, however, were boosted by the announcement of Screaming Eagle Acquisition Corp's US$4 billion-plus business combination with Lionsgate Studios, which White & Case advised on.
Deal volume in Q4 2023 was steady on a quarter-onquarter basis, with 19 deals versus the 21 de-SPAC deals announced in Q3 2023.
1 https://www.reuters.com/markets/deals/dealmakers-see-rebound-after-global-ma-volumes-hit-decade-low-2023-12-21/. See pars 1-2.
US SPAC IPOs: Commentary
New SPAC listing activity decreased in 2023, with only 30 SPAC IPOs pricing on US stock exchanges through the course of the year, down from 84 in 2022.
SPAC IPOs proceeds also declined, with proceeds down 72 percent from US$13.12 billion in 2022 to just US$3.67 billion in 2023.
Investor appetite for new SPAC listings has been tempered by higher interest rates, volatile stock markets and limited investor support for IPOs generally.
On a quarterly basis, SPAC listings were also limited, with only eight SPAC IPOs raising proceeds of US$829 million in Q4 2023, versus six listings raising US$928 million in Q3 2023.
Of the 30 SPAC IPOs in the US in 2023, Nasdaq was the stock exchange of choice with 26 listed SPAC IPOs. Only four were listed on the New York Stock Exchange (NYSE).
In 2022, Nasdaq had 72 SPAC IPOs, and the NYSE secured 12 SPAC IPOs.
The tough conditions for SPAC IPOs stand in contrast to figures for overall US IPO activity.
According to EY analysis of Dealogic figures, the number of US IPOs in 2023 climbed 42 percent when compared to 2022, while proceeds rose 160 percent year-on-year.
US de-SPAC M&A data
These statistics track the de-SPAC mergers involving a US target from January 1, 2019 to December 31, 2023
Annual summary of de-SPAC transactions in the US
| Rank date | Number of deals | Market share (%) |
| 2019 | 30 | 6 |
| 2020 | 99 | 19 |
| 2021 | 196 | 39 |
| 2022 | 93 | 18 |
| 2023 | 93 | 18 |
| Industry Total | 511 | 100 |
Source: Refinitiv Workspace | Market share is based on number of deals
Quarterly summary of de-SPAC transactions in the US
| Rank date | Number of deals | Market share % |
| 2019 Q1 | 3 | 1 |
| 2019 Q2 | 4 | 1 |
| 2019 Q3 | 13 | 2 |
| 2019 Q4 | 10 | 2 |
| 2020 Q1 | 9 | 2 |
| 2020 Q2 | 8 | 2 |
| 2020 Q3 | 34 | 7 |
| 2020 Q4 | 48 | 9 |
| 2021 Q1 | 80 | 16 |
| 2021 Q2 | 51 | 10 |
| 2021 Q3 | 28 | 5 |
| 2021 Q4 | 37 | 7 |
| 2022 Q1 | 13 | 2 |
| 2022 Q2 | 24 | 5 |
| 2022 Q3 | 21 | 4 |
| 2022 Q4 | 35 | 7 |
| 2023 Q1 | 32 | 6 |
| 2023 Q2 | 21 | 4 |
| 2023 Q3 | 21 | 4 |
| 2023 Q4 | 19 | 4 |
| Industry Total | 511 | 100 |
Source: Refinitiv Workspace | Market share is based on number of deals
Number of de-SPAC deals in the US by target industry
| Target macro-industry | Number of deals | Market share % |
| Healthcare | 24 | 26 |
| High Technology | 22 | 24 |
| Energy and Power | 14 | 15 |
| Consumer Products and Services | 8 | 9 |
| Industrials | 7 | 8 |
| Telecommunications | 5 | 5 |
| Financials | 4 | 4 |
| Consumer Staples | 3 | 3 |
| Retail | 2 | 2 |
| Media and Entertainment | 2 | 2 |
| Materials | 2 | 2 |
| Industry Total | 93 | 100 |
Source: Refinitiv Workspace | Market share is based on number of deals
De-SPAC M&A: Sectors in focus
Healthcare
Top-three largest de-SPAC deals:
- Semper Paratus Acquisition Corp. announced a US$1.41 billion business combination with Tevogen Bio
- American Gene Technologies agreed to an US$800 million business combination with 10X Capital Venture Acquisition Corp.
- Atlantic Coastal Acquisition Corp II announced a US$750 million business combination with Abpro Corp.
Healthcare ranked as the most active sector for business combination deal value and volume in 2023, with 24 business combinations worth US$7.54 billion.
Healthcare business combination deal value dropped 11 percent year-on year from the US$8.49 billion figure for 2022.
Healthcare business combination transaction volume and value, however, remain well ahead of pre-pandemic levels. The healthcare sector has been resilient in the face of macro-economic headwinds, which has made it a preferred option for investors in a choppy market.
Rapid innovation in biotech and healthtech have been some of the key drivers for business combinations in healthcare.
In the largest de-SPAC deal of 2023, Tevogen Bio, a developer of T-cell therapy technologies used in COVID-19 treatments2, agreed to a US$1.41 billion business combination with Semper Paratus Acquisition Corp.
The second-largest healthcare de-SPAC of 2023 was also in the biotech space, with American Gene Technologies agreeing to an US$800 million business combination with 10X Capital Venture Acquisition Corp. American Gene Technologies, which will be renamed Addimmune on completion, is a clinical-stage gene and cell therapy company developing a cure for HIV3.
In the third-largest healthcare de-SPAC in 2023, Atlantic Coastal Acquisition Corp II announced a business combination with antibody developer Abpro Corp. in a US$725 million deal. Abpro chose to seek a listing through a de-SPAC business combination, having pulled back from pursuing a traditional IPO five years ago4.
This transaction illustrates how a de-SPAC deal remains an attractive and flexible route to a public listing, even though overall de-SPAC transaction flow has decreased
2 https://www.reuters.com/markets/deals/biotech-firm-tevogen-bio-enters-12-bln-spac-deal-us-listing-2023-06-29/
3 https://news.spacconference.com/2023/08/10/gene-therapy-companymerging-with-10x-capital-venture-acquisition-iii-in-500m-deal/
4 https://www.fiercebiotech.com/biotech/abpro-taps-spac-get-back-nasdaqtrack-inking-deal-fund-bispecific-work-5-years-after-axe
Technology
Top-two largest de-SPAC deals:
- iLearningEngines announced a US$1.28 billion business combination with Arrowroot Acquisition Corp.
- Blaize announced a US$700 million business combination with BurTech Acquisition Corp.
Technology was the second-largest de-SPAC sector by value and volume in 2023, with 22 business combination deals worth US$5.07 billion.
Technology M&A slowed during 2023 after record levels of technology dealmaking in 2021.
Companies with developing cybersecurity, data analytics, machine learning and generative artificial intelligence (GenAI) technologies, however, have continued to attract investor interest and sustain de-SPAC technology transaction flow.
The largest de-SPAC technology deal of 2023 saw AIpowered training provider iLearning agree to a US$1.28 billion business combination with Arrowroot Acquisition Corp, with plans to use the proceeds to fund platform acquisitions after the deal closes.
In the second-largest technology de-SPAC deal of 2023, Blaize, a provider of AI-enabled edge computing technology, agreed to a US$700 million business combination with BurTech Acquisition Corp. that will support a geographic roll-out and further investment in proprietary technology5.
Media & entertainment
Top-two largest de-SPAC deals:
- Screaming Eagle Acquisition Corp. announced a US$4.44 billion business combination with Lionsgate Studios
- Kustom Entertainment announced a US$125 million business combination with Clover Leaf Capital Corp.
The media & entertainment sector only saw two de-SPAC deals in 2023, but still ranked as the third-largest sector by de-SPAC deal value, thanks to Screaming Eagle Acquisition Corp.’s US$4.44 billion business combination deal with Lionsgate Studios.
In the only other business combination in media & entertainment in 2023, Kustom Entertainment, a live events, concert production and ticketing company, announced a US$125 million business combination with Clover Leaf Capital Corp.
Kustom Entertainment is a wholly owned subsidiary of Digital Ally, a business primarily focused on providing law enforcement agencies with body and in-vehicle cameras.
The deal with Clover Leaf Capital Corp. will provide Kustom Entertainment with the ability to operate as a standalone entity focused on producing events and festivals alongside its primary and secondary ticketing technologies6.
Energy and power
Top-three largest de-SPAC deals:
- Oklo agreed to a US$1 billion business combination with AltC Acquisition Corp.
- Honeycomb Battery Co. announced a US$954.6 million business combination with Nubia Brand International Corp.
- Montana Technologies announced a US$618.14 million business combination with Power & Digital Infrastructure Acquisition II Corp.
The energy and power sector ranked as the third-largest for de-SPAC deal volume and fourth-largest for value in 2023, recording 14 business combinations worth US$4.1 billion.
Energy transition has been the primary driver of de-SPAC deal activity in the energy and power sector, with investors looking for opportunities to build exposure to companies with the technology and capabilities that will be required to decarbonize industries and economies.
International Energy Agency forecasts predicted that investment in clean energy outpaced investment in hydrocarbons by a ratio of 1.7:1 in 20237. Investors have recognized the long-term commercial opportunity energy transition presents and have moved to invest accordingly.
In the largest energy and power business combination of 2023 Oklo, a nuclear reactor business providing emission-free energy, agreed to a US$1 billion business combination with AltC Acquisition Corp., a SPAC backed by Sam Altman, the chief executive of OpenAI, the developer of ChatGPT8.
In the second-largest energy and power de-SPAC of 2023, electric vehicle developer Honeycomb Battery Co., a subsidiary or Global Graphene Group, agreed to a US$954.6 million business combination with Nubia Brand International Corp9.
The third-largest de-SPAC deal in the energy and power sector in 2023 saw Montana Technologies announce a US$618.14 million business combination with Power & Digital Infrastructure Acquisition II Corp. Montana Technologies develops renewable energy and cooling technologies10.
7 https://www.iea.org/reports/world-energy-investment-2023/overview-and-key-findings. See par 2
8 https://www.reuters.com/article/oklo-m-a-altc-acquisition-idUSKBN2YR0ZO
9 https://www.graphene-info.com/global-graphene-groups-honeycomb-batterymerges-spac-company-deal-worth-over
10 https://news.spacconference.com/2023/06/05/montana-technologies-tocombine-with-power-digital-infrastructure-acquisition-ii-in-500m-deal/
Industrials
Top-three largest de-SPAC deals:
- Kernel Group Holdings agreed to a US$1.1 billion business combination with AIRO Group Holdings
- Marblegate Acquisition Corp. and DePalma agreed to a US$755 million business combination
- Humble Imports agreed to a US$225 million business combination with EF Hutton Acquisition Corp I
The industrials sector ranked as the fifth-largest for de-SPAC deal activity by volume and value in 2023, with seven business combination deals worth a combined US$2.27 billion.
The deal drivers of de-SPAC activity in the technology and energy and power sectors have also been prominent in the industrials space. Digitalizing industrial processes and decarbonizing manufacturing have been key drivers for industrials de-SPAC deals in 2023.
The largest industrials de-SPAC deal of 2023 saw Kernel Group Holdings and aerospace and defense company AIRO Group Holdings announce a US$1.1 billion business combination. AI capability was a key driver for the investment in AIRO, which develops drone, AI and air taxi technology11.
Marblegate Acquisition Corp. and DePalma, a company holding taxi operation licenses in New York, Philadelphia and Chicago12, led the second-largest industrials de-SPAC deal of the year when agreeing to a US$755 million business combination.
The third-largest industrials de-SPAC deal of 2023 saw Humble Imports, a manufacturer of restored Land Rover Defender vehicles, agree to a US$225 million business combination with EF Hutton Acquisition Corp I13.
The de-SPAC industrials deal figures, however, were directly impacted by the market uncertainties of 2023.
In what would have otherwise been the third-largest industrials business combination of 2023, World View Enterprises, a stratospheric flight and exploration business14, and Leo Holdings Corp II mutually agreed to terminate their previously announced US$350 million business combination, citing challenging market conditions. Leo said that it would dissolve and liquidate after the business combination was called off15.
11 https://www.flyingmag.com/kernel-group-holdings-to-merge-with-evtoldeveloper-airo-group/
12 https://news.spacconference.com/2023/02/22/marblegate-acquisitionmerging-with-depalma-companies-in-755m-deal/
13 https://finance.yahoo.com/news/ef-hutton-acquisition-corporationsigns-201500663.html
14 https://www.businesswire.com/news/home/20230112005881/en/Stratospheric-Exploration-Leader-World-View-to-Go-Public-via-SPAC-Deal-with-Leo-Holdings-Corp.-II
15 https://www.businesswire.com/news/home/20231117842377/en/World-Viewand-Leo-Holdings-Corp.-II-Intend-to-Mutually-Agree-to-Terminate-Business-Combination-Agreement
US SPAC IPOs data
These statistics track the SPAC IPOs that have listed on US stock exchanges from January 1, 2019 to December 31, 2023
Annual breakdown of US-listed SPAC IPOs
| Year | Number of issues | SPAC IPO market share (%) |
| 2019 | 59 | 6 |
| 2020 | 247 | 24 |
| 2021 | 613 | 59 |
| 2022 | 84 | 8 |
| 2023 | 30 | 3 |
| Total | 1,033 | 100 |
Source: Refinitiv Workspace | Note: Market share was calculated on the basis of number of issues
Quarterly breakdown of US-listed SPAC IPOs
| Rank date | Number of deals | Market share % |
| 2019 Q1 | 15 | 1.5 |
| 2019 Q2 | 13 | 1.3 |
| 2019 Q3 | 14 | 1.4 |
| 2019 Q4 | 17 | 1.6 |
| 2020 Q1 | 13 | 1.3 |
| 2020 Q2 | 24 | 2.3 |
| 2020 Q3 | 82 | 7.9 |
| 2020 Q4 | 128 | 12.4 |
| 2021 Q1 | 297 | 28.8 |
| 2021 Q2 | 64 | 6.2 |
| 2021 Q3 | 88 | 8.5 |
| 2021 Q4 | 164 | 15.9 |
| 2022 Q1 | 54 | 5.2 |
| 2022 Q2 | 14 | 1.4 |
| 2022 Q3 | 8 | 0.8 |
| 2022 Q4 | 8 | 0.8 |
| 2023 Q1 | 10 | 1.0 |
| 2023 Q2 | 6 | 0.6 |
| 2023 Q3 | 6 | 0.6 |
| 2023 Q4 | 8 | 0.8 |
| Industry Total | 1,033 | 100 |
Source: Refinitiv Workspace | Note: Market share was calculated on the basis of number of issues
Annual Nasdaq and NYSE breakdown of US-listed SPAC IPOs
| Year | Listed on Nasdaq | Listed on NYSE | Total |
| 2019 | 43 | 16 | 59 |
| 2020 | 131 | 116 | 247 |
| 2021 | 432 | 181 | 613 |
| 2022 | 72 | 12 | 84 |
| 2023 | 26 | 4 | 30 |
| Total | 704 | 329 | 1,033 |
Source: Refinitiv Workspace
Top 10 US SPAC IPO issuers by proceed amount
| Issuer | Number of issues | SPAC IPO market share % | Total proceeds US$ million |
| Pershing Square Tontine Holdings Ltd | 1 | 0.1 | 4,000.00 |
| Churchill Capital Corp IV | 1 | 0.1 | 2,070.00 |
| Soaring Eagle Acquisition Corp | 1 | 0.1 | 1,725.00 |
| Foley Trasimene Acquisition Corp II | 1 | 0.1 | 1,467.03 |
| Austerlitz Acquisition Corp II | 1 | 0.1 | 1,380.00 |
| Churchill Capital Corp VII | 1 | 0.1 | 1,380.00 |
| KKR Acquisition Holdings I Corp | 1 | 0.1 | 1,380.00 |
| Social Capital Hedosophia Holdings Corp VI | 1 | 0.1 | 1,150.00 |
| Foley Trasimene Acquisition Corp | 1 | 0.1 | 1,035.00 |
| Jaws Mustang Acquisition Corp | 1 | 0.1 | 1,035.00 |
Source: Refinitiv Workspace | Note: Market share was calculated on the basis of number of issues
Country of issuer by number of US SPAC IPO listings
Full-year 2023
| Issuer | Number of issues | Market share % |
| United States | 25 | 84 |
| China (Mainland) | 2 | 7 |
| Taiwan | 1 | 3 |
| Malaysia | 1 | 3 |
| Canada | 1 | 3 |
| Industry Total | 30 | 100 |
Source: Refinitiv Workspace | Note: Market share was calculated on the basis of number of issues
Full-year 2022
| Issuer | Number of issues | Market share (%) |
| United States | 65 | 77 |
| Singapore | 4 | 5 |
| Cayman Islands | 4 | 5 |
| Malaysia | 3 | 4 |
| China (Mainland) | 3 | 4 |
| Hong Kong SAR | 2 | 3 |
| United Kingdom | 1 | 1 |
| Sweden | 1 | 1 |
| Mexico | 1 | 1 |
| Industry Total | 84 | 100 |
Source: Refinitiv Workspace | Note: Market share was calculated on the basis of number of issues
Full-year 2021
| Issuer | Number of issues | Market share (%) |
| United States | 538 | 87.8 |
| Cayman Islands | 26 | 4.2 |
| Hong Kong SAR | 16 | 2.6 |
| United Kingdom | 5 | 0.8 |
| Singapore | 5 | 0.8 |
| Malaysia | 4 | 0.7 |
| Israel | 4 | 0.7 |
| China (Mainland) | 2 | 0.3 |
| Taiwan | 1 | 0.2 |
| Switzerland | 1 | 0.2 |
| South Africa | 1 | 0.2 |
| Russia | 1 | 0.2 |
| Netherlands | 1 | 0.2 |
| Mexico | 1 | 0.2 |
| Kazakhstan | 1 | 0.2 |
| Germany | 1 | 0.2 |
| Cyprus | 1 | 0.2 |
| Canada | 1 | 0.2 |
| Brazil | 1 | 0.2 |
| Bermuda | 1 | 0.2 |
| Bahamas | 1 | 0.2 |
| Industry Total | 613 | 100 |
Source: Refinitiv Workspace | Note: Market share was calculated on the basis of number of issues
Full-year 2020
| Issuer | Number of issues | Market share (%) |
| United States | 224 | 90.7 |
| China (Mainland) | 5 | 2.0 |
| Cayman Islands | 5 | 2.0 |
| United Kingdom | 4 | 1.6 |
| Hong Kong SAR | 4 | 1.6 |
| Singapore | 2 | 0.8 |
| Russia | 1 | 0.4 |
| Mexico | 1 | 0.4 |
| Israel | 1 | 0.4 |
| Industry Total | 247 | 100 |
Source: Refinitiv Workspace | Note: Market share was calculated on the basis of number of issues
Full-year 2019
| Issuer | Number of issues | Market share (%) |
| United States | 52 | 88 |
| Singapore | 2 | 3 |
| Hong Kong SAR | 2 | 3 |
| Mexico | 1 | 2 |
| China (Mainland) | 1 | 2 |
| Cayman Islands | 1 | 2 |
| Industry Total | 59 | 100 |
Source: Refinitiv Workspace | Note: Market share was calculated on the basis of number of issues
Country of issuer by total number of US SPAC IPO listings
This chart shows US SPAC IPOs by the country of issuer (by number of issues between January 2019 and December 2023).
| Issuer | Number of issues | Market share % |
| United States | 904 | 87.5 |
| Cayman Islands | 36 | 3.5 |
| Hong Kong SAR | 24 | 2.3 |
| Singapore | 13 | 1.3 |
| China (Mainland) | 13 | 1.3 |
| United Kingdom | 10 | 1.0 |
| Malaysia | 8 | 0.8 |
| Israel | 5 | 0.5 |
| Mexico | 4 | 0.4 |
| Russia | 2 | 0.2 |
| Canada | 2 | 0.2 |
| Taiwan | 2 | 0.2 |
| Sweden | 1 | 0.1 |
| South Africa | 1 | 0.1 |
| Bahamas | 1 | 0.1 |
| Netherlands | 1 | 0.1 |
| Germany | 1 | 0.1 |
| Brazil | 1 | 0.1 |
| Kazakhstan | 1 | 0.1 |
| Cyprus | 1 | 0.1 |
| Bermuda | 1 | 0.1 |
| Switzerland | 1 | 0.1 |
| Industry Total | 1,033 | 100 |
Source: Refinitiv Workspace | Note: Market share was calculated on the basis of number of issues
The issuer’s country is based on the address for notices provided by a SPAC on its registration statement and other relevant sources, and does not necessarily reflect the SPAC’s jurisdiction of incorporation or formation.
Beyond the numbers
Turning a corner
The SPAC market had a rough ride in 2023, but as interest rates top out and M&A markets defrost, SPAC sponsors will be hoping that better times lie ahead in 2024.
The past 12 months have not been easy for the US SPAC market.
De-SPAC deal value and SPAC IPO proceeds suffered large double-digit declines, high-profile companies that went public via business combination deals filed for bankruptcy,16 and, according to SPAC Insider, 193 SPACs announced liquidations in 202317.
As tough as the past 12 months have been, however, there are hopes that 2024 will see a market reset and a recovery in IPO and deal markets.
SPAC Insider notes that the market may have worked through the worst of the liquidation backlog in 2023, and that there are, still 268 SPACs entering 2024 that have either already announced a deal or are on the lookout for a transaction.
The announcement of a US$4.44 billion business combination between Screaming Eagle Acquisition Corp. and Lionsgate Studios in December 202318 could help to build momentum going into 2024.
Listings via de-SPACs have also proven attractive for companies in niche growth sectors, including sports betting, cryptocurrency and clean energy technology, showing that the SPAC model can still offer value, even though IPO and business combination deal flow has declined materially since 2021.
Sponsors will also be hoping that efforts to enhance the SPAC structure in 2023, with the emergence of the special purpose acquisition rights company (SPARC), can help to breathe new energy into the blank check company space.
Rather than issuing shares, SPARCs give their investors the option to buy shares in the SPARC once a deal has been announced19. This will avoid situations where blank check companies sit on cash for extended periods of time, or have to return capital to investors when failing to find a deal target.
This is still an unpredictable time for SPACs. According to SPAC Insider, the first quarter of 2024 will be crucial for the market’s prospects, as just under 100 SPACs will face investment period deadlines. SPAC shareholders will need to decide whether to give SPACs more time to find a deal, or redeem their shares and wind SPACs down20. Investors and sponsors will be monitoring these shareholder votes closely to see how may SPACS are able to stay in business and keep looking for deals
Despite lingering uncertainty after a tough year, prospects are at least looking a little more promising than they were at that start of 2023. Dynamics in the SPAC market, such as the value companies put on the SPAC structure’s flexibility and the consolidation within the marketplace, will hopefully provide the foundation for more SPAC IPO and de-SPAC deal activity in 2024.
16 https://fortune.com/2023/11/07/wework-spac-bankruptcy-chapter-11-core-scientific-virgin-orbit/
17 https://www.spacinsider.com/news/headline-post/morning-roundup-january-2-2024
18 https://www.bloomberg.com/news/articles/2023-12-22/lionsgate-studios-to-go-public-in-screaming-eagle-spac-deal
19 https://www.reuters.com/markets/deals/how-bill-ackmans-sparc-differs-spac-2023-10-02/#:~:text=One%20of%20the%20biggest%20differences,than%20naming%20the%20specific%20target.
20 https://www.spacinsider.com/news/headline-post/morning-roundup-january-2-2024